Welcome to the world of SFDs
Improving understanding of urban sanitation
Find guidance and support for creating SFD graphics and reports: the SFD Graphic Generator allows you to create your own SFD graphic for any given city.
Welcome to the world of SFDs
Find guidance and support for creating SFD graphics and reports: the SFD Graphic Generator allows you to create your own SFD graphic for any given city.
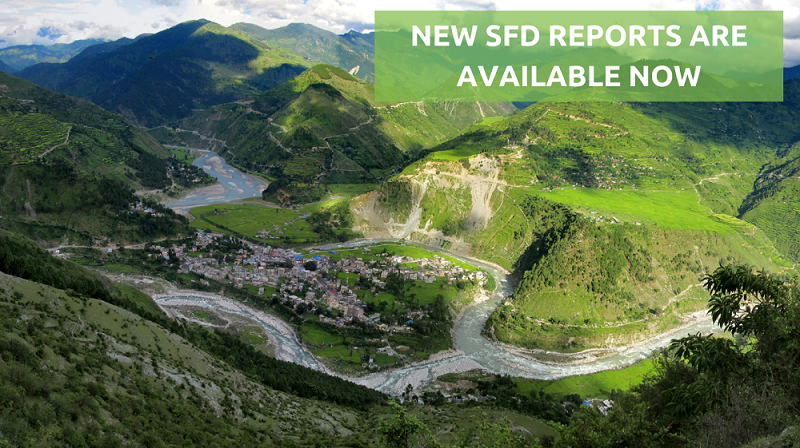
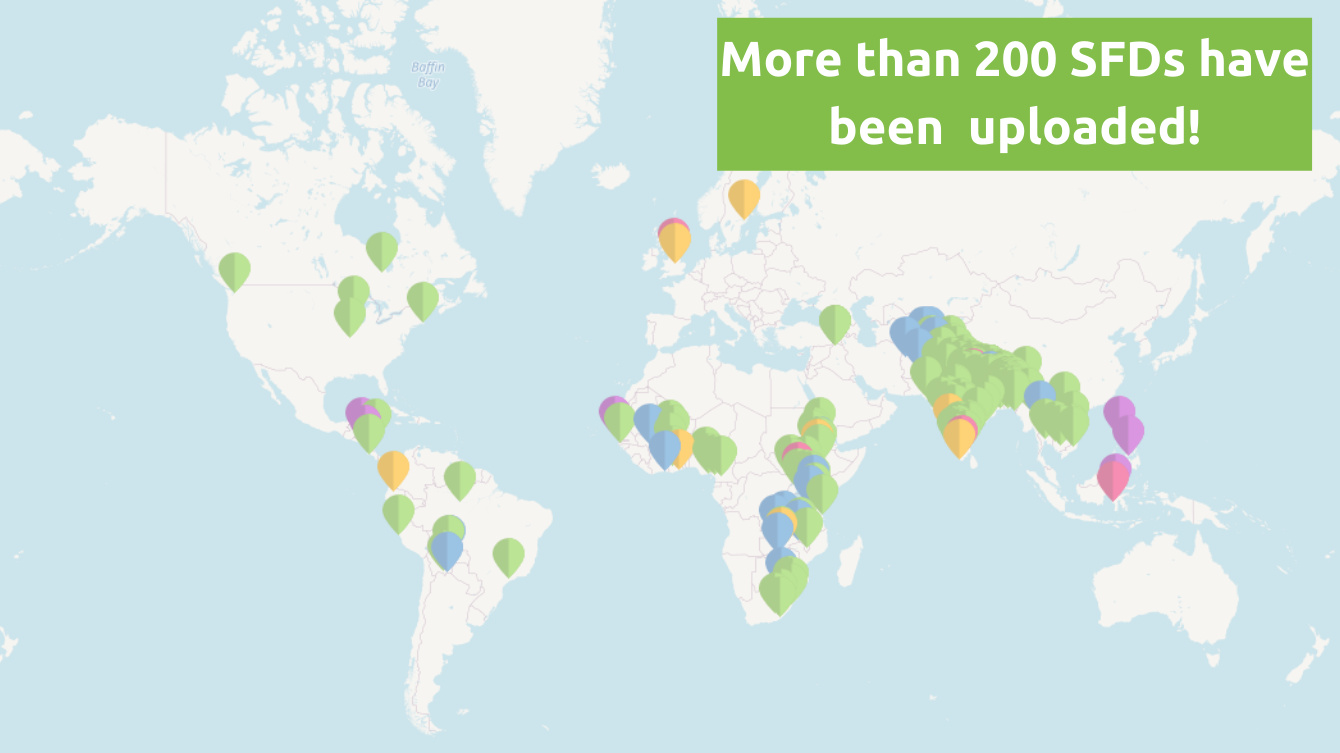
New SFD Reports
There are nine new SFDs (Chingola, Choma, Kabwe, Kafue, Kitwe, Mansa, Mahakali Municipality, Banepa Municipality, Jayaprithvi Municipality) accessible through our database now.
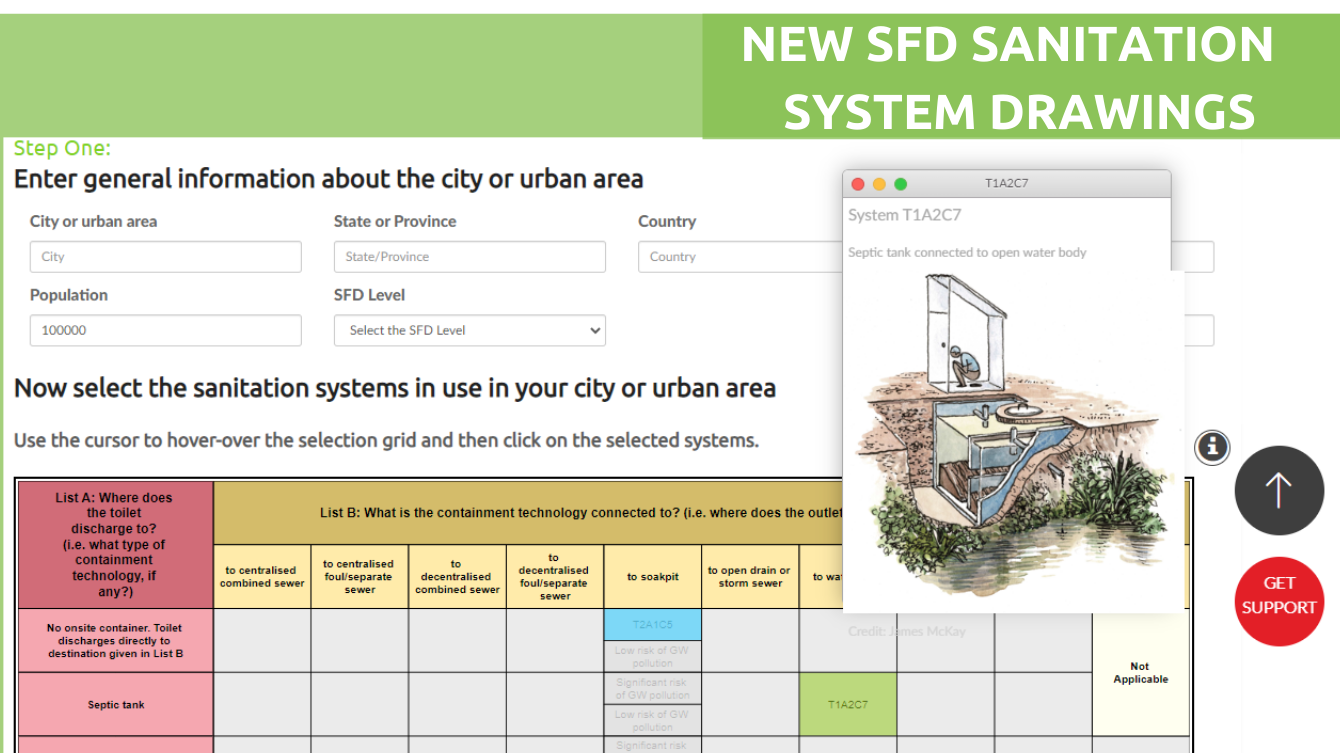
Check out the new drawings on the SFD graphic generator - when selecting sanitation systems, you can now see what each of the systems look like and double check that it matches the situation in your city.
A BIG thank you to the artist James McKay of the University of Leeds for producing the drawings – we think they are great!
Please take a look at the page and let us know what you think?
SFD Reports
Browse through all the entries and read more.
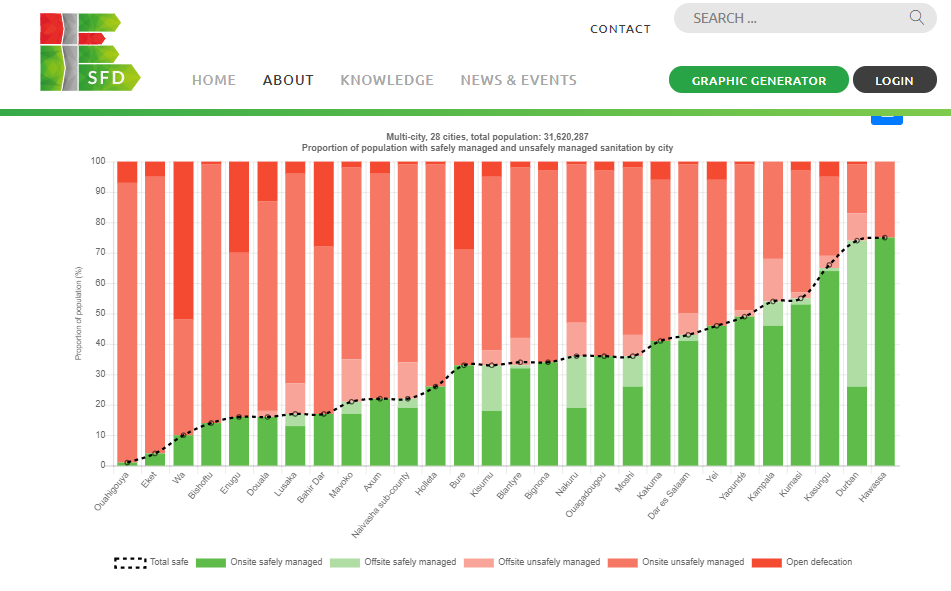
NEW SFD DATA PAGE
Check out the new page where you can compare SFD data from over 150 cities.
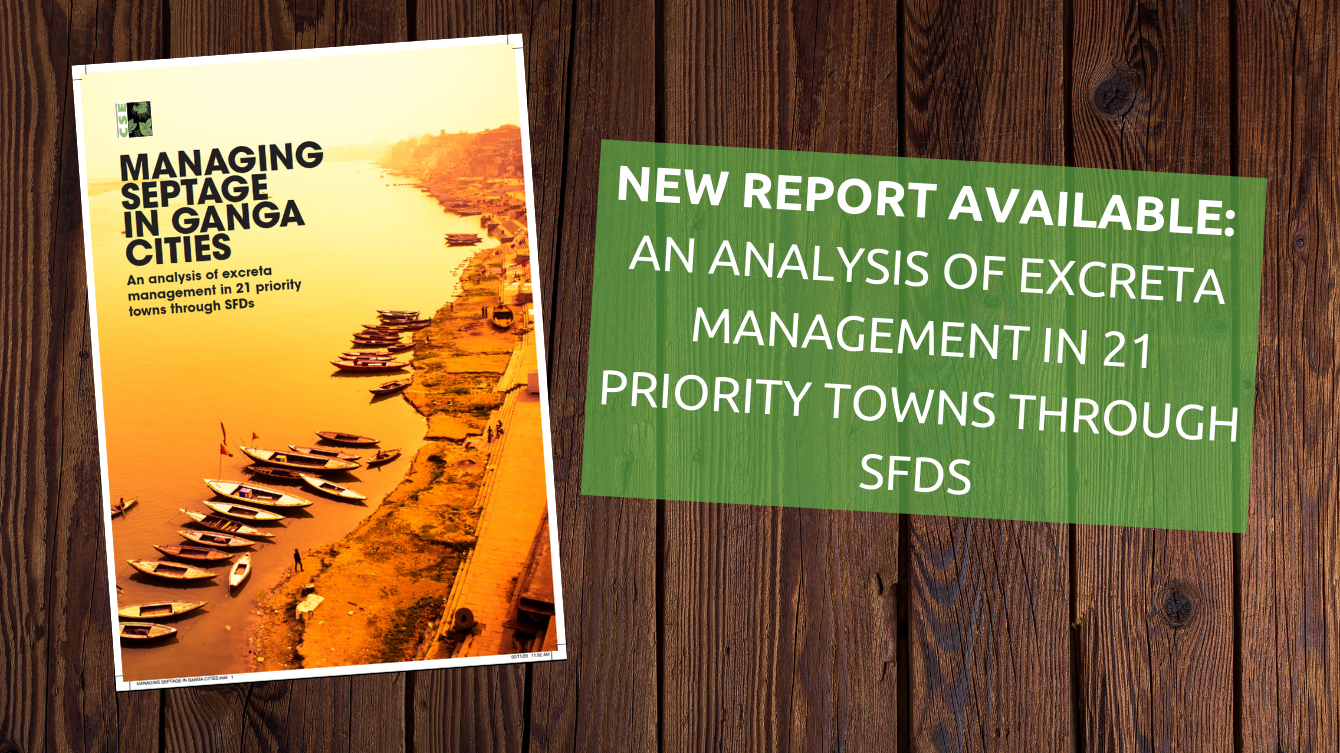
New Report available
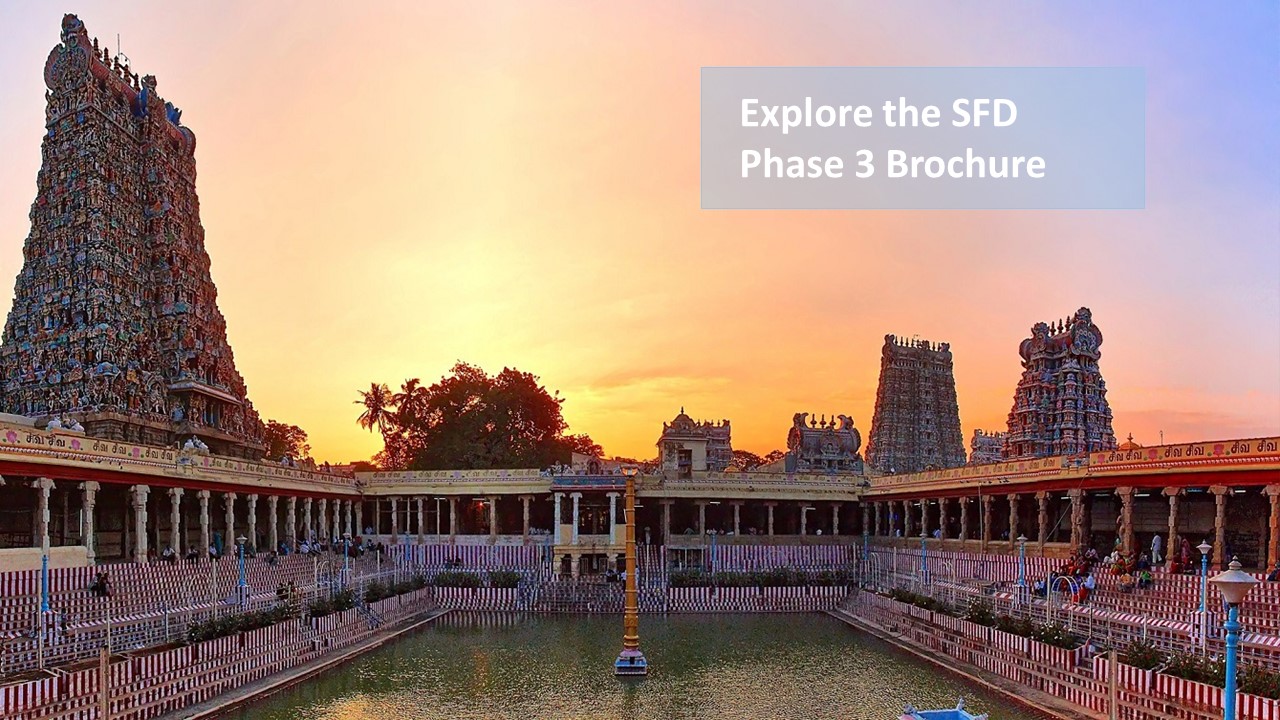
SFD Promotion Initiative
Discover the brochure of CSE's SFD Phase III activities. CSE officially launched their SFD phase III in India in collaboration with the Ministry of Jal Shakti, in South Africa, and in Bangladesh.
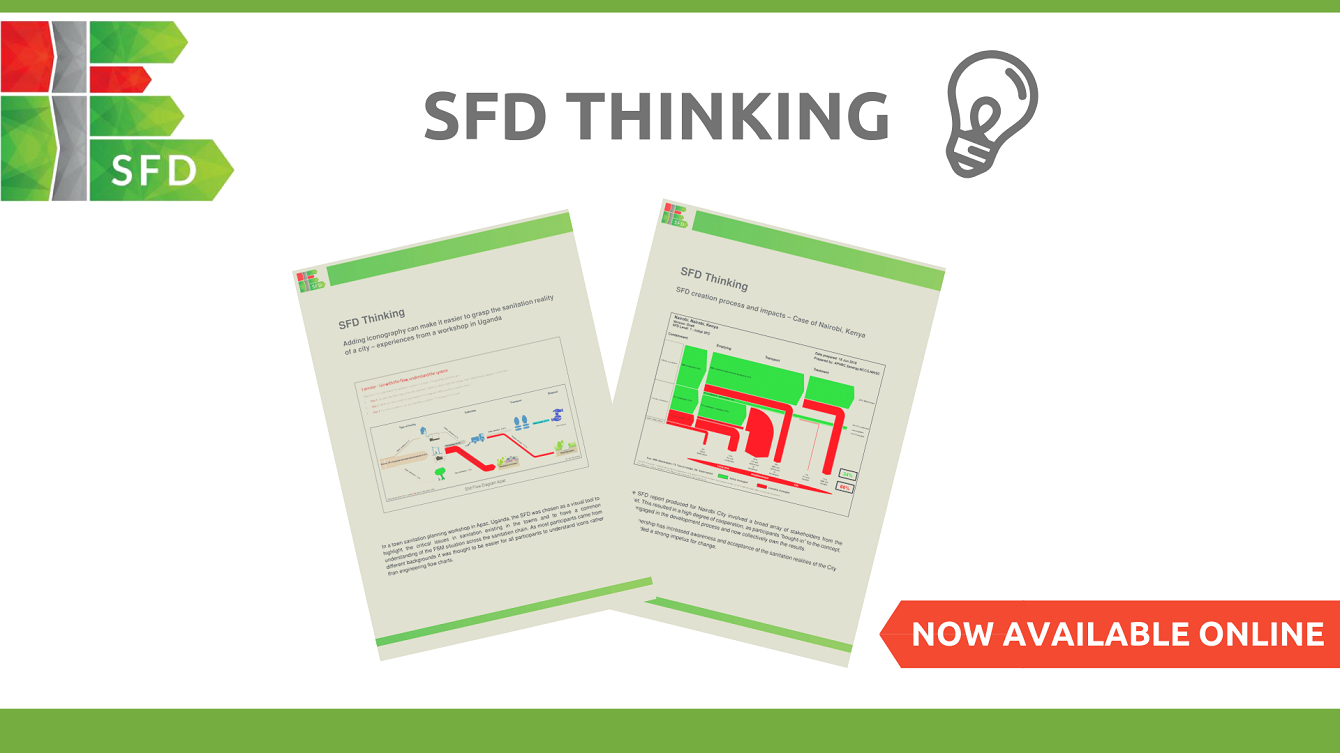
SFD Thinking
Explore the new SFD Thinking and discover interesting facts, ideas and approaches on how to use SFDs.
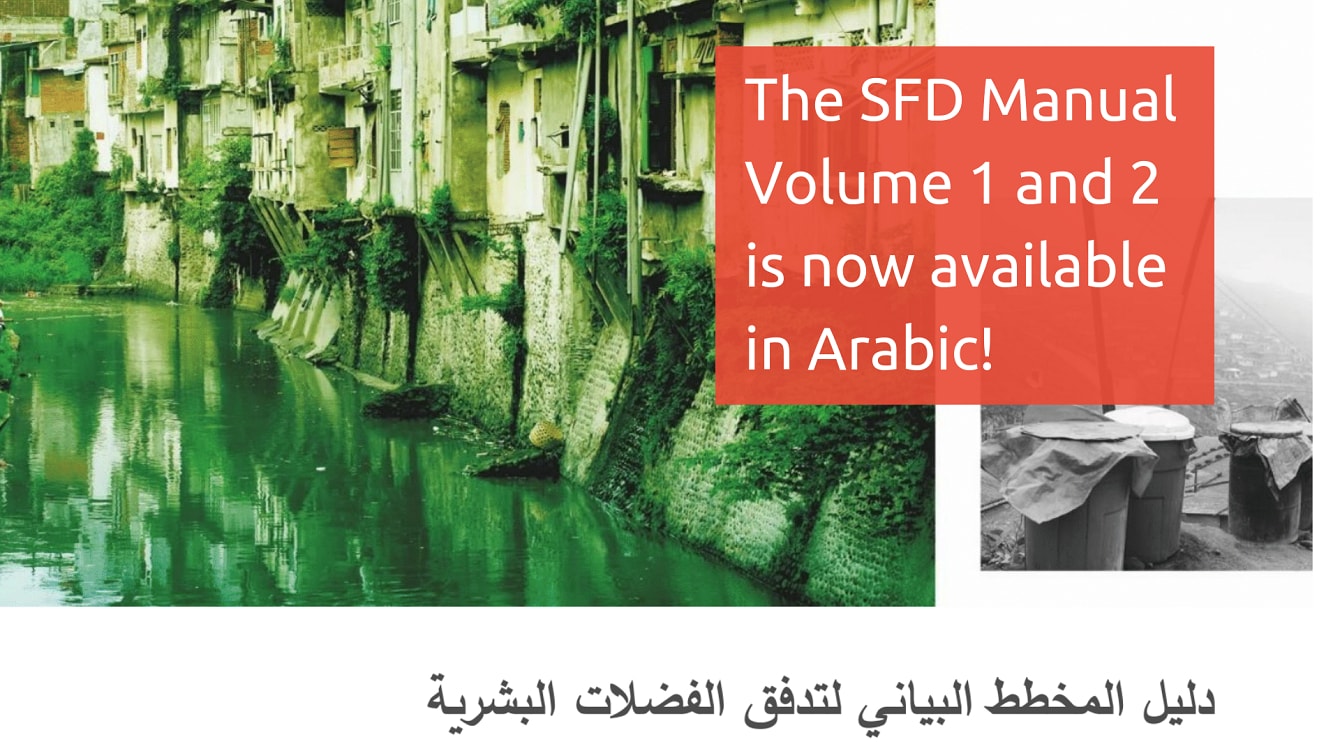
SFD Manual
The SFD Manual was translated to Arabic and can be downloaded from the SuSanA Library!
An excreta flow diagram (also often described as shit flow diagram, SFD) is a tool to readily understand and communicate how excreta physically flows through a city or town.
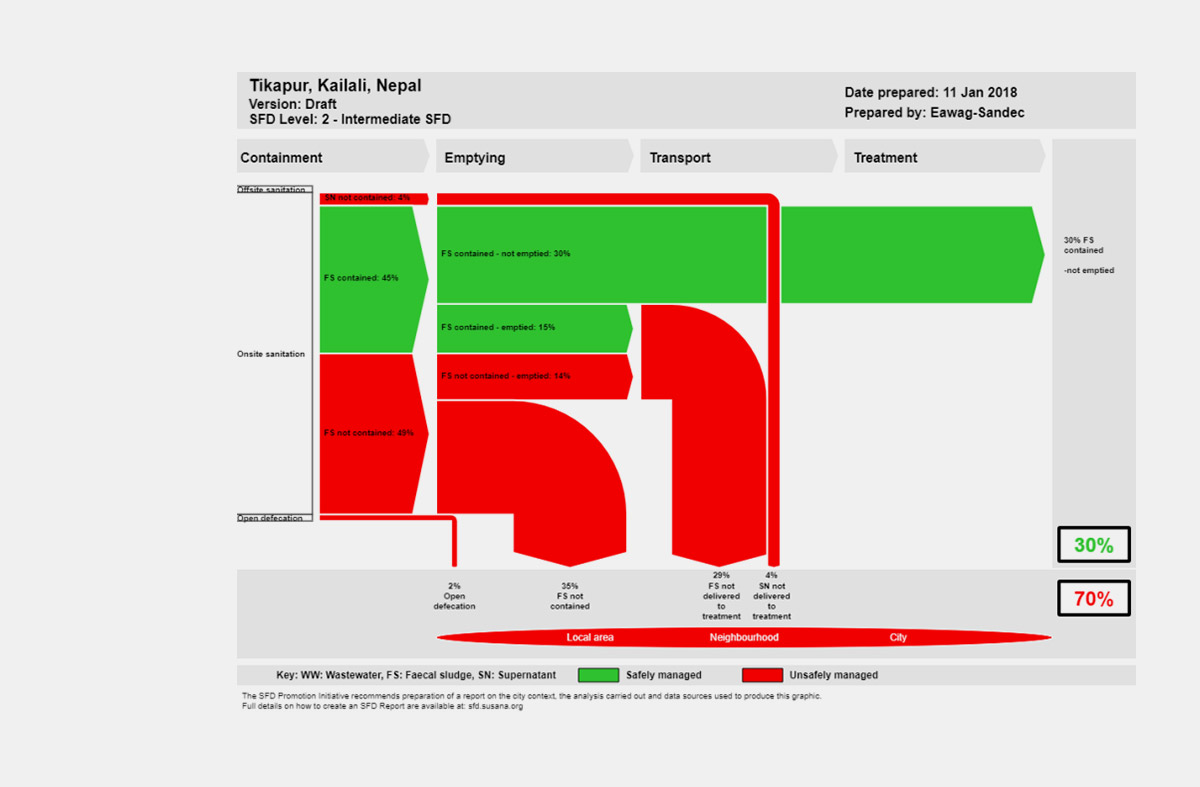
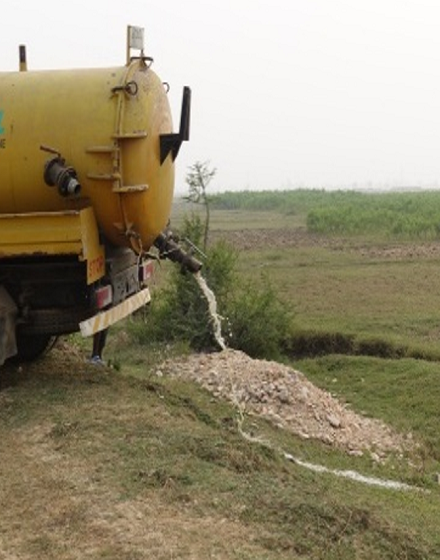
The fate of excreta produced by populations across the globe is often poorly understood. SFDs show how it is or is not managed as it moves from defecation to disposal or end-use. The SFD report presents the service delivery context of the city or town and the data sources used for the assessment.
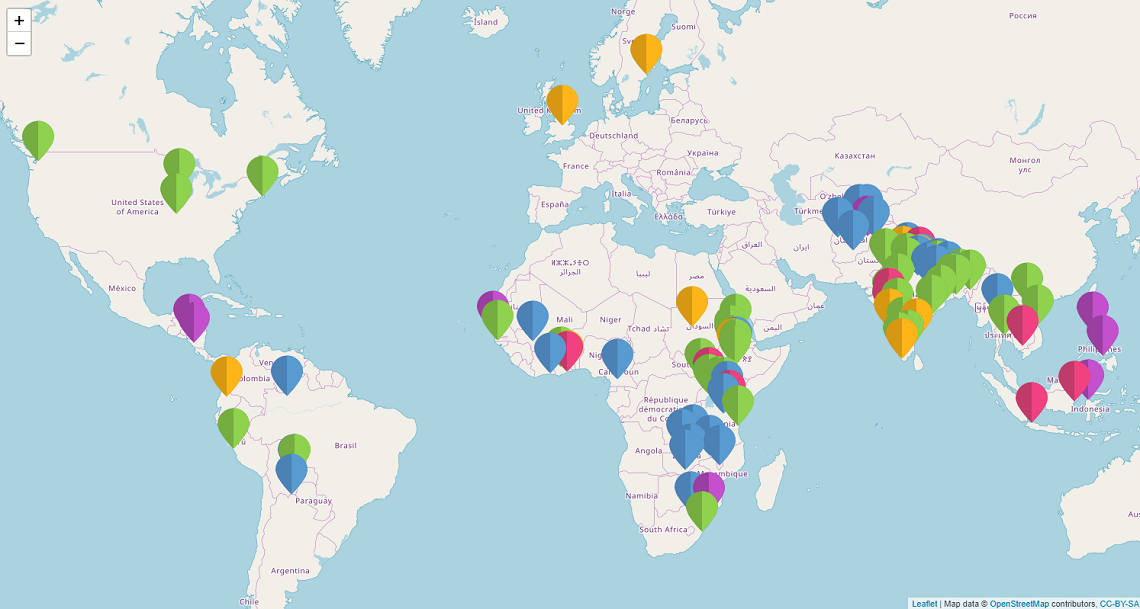
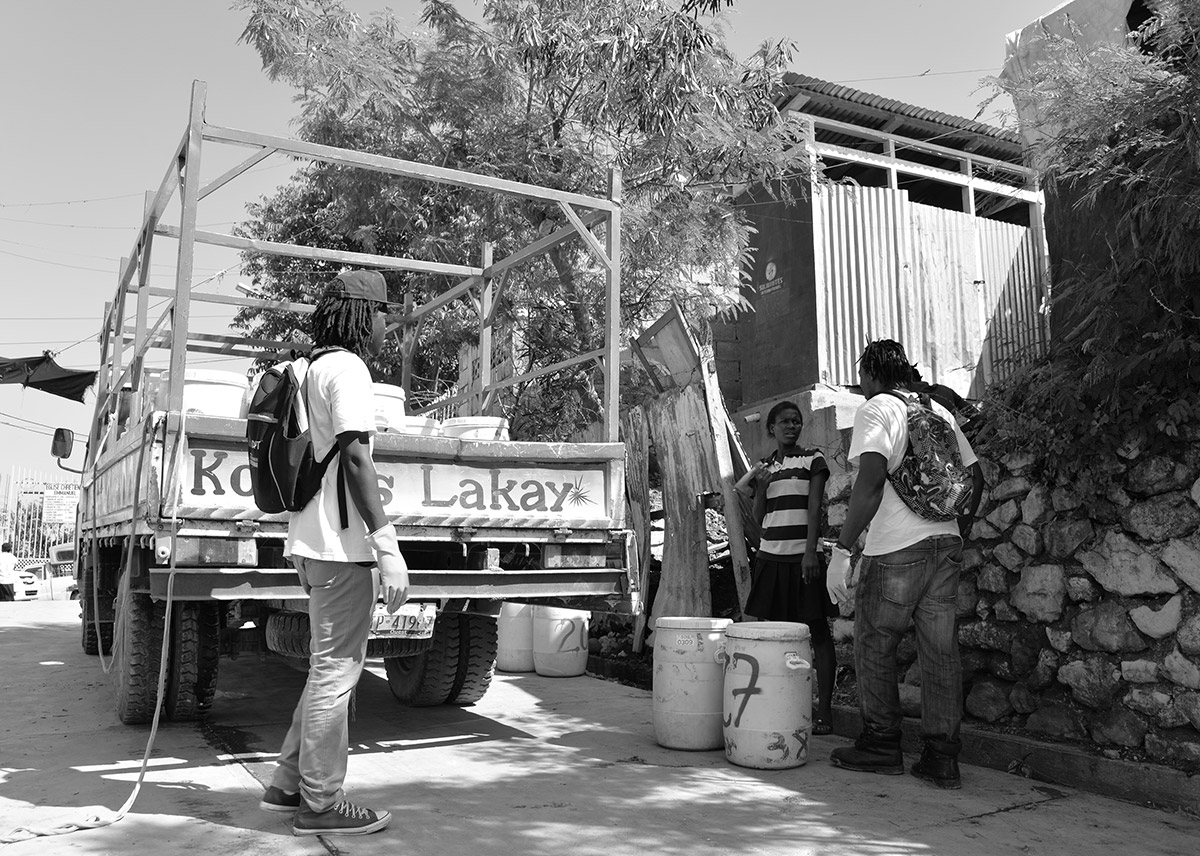
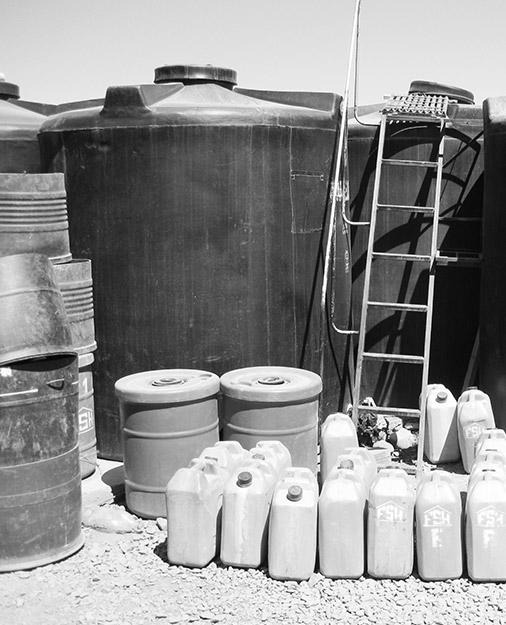
Discover the SFD reports, training events and presentations across the world.
As sanitation practitioners and city officials recognize how effective SFDs are in engaging and stimulating dialogue on excreta management to achieve better sanitation, the number of SFDs being prepared all over the world is increasing.
Do you want to prepare an SFD? Check out the tutorial videos, FAQs and the SFD Manual.
The SFD Manual describes the process followed within the SFD Promotion Initiative for the production of SFD graphics and reports. It includes guidance on data collection and analysis on how to use the SFD Graphic Generator and the definitions of terms and variables.
Discover the world of SFDs!
Direct Search
From 2014 – 2018 the SFD Promotion Initiative has been managed by GIZ under the umbrella of the Sustainable Sanitation Alliance (SuSanA), supported by the Bill & Melinda Gates Foundation through two grants (2014-2015 and 2016-2018). Phase III of the SFD Promotion Initiative is being managed by the University of Leeds and the Center for Science and Environment, supported by the Bill & Melinda Gates Foundation through two additional grants. The secretariat of the SFD Webportal and Helpdesk are remaining with GIZ as part of the SuSanA secretariat.


The Centre for Science and Environment (CSE); the Global Sector Program on Sustainable Sanitation of the Deutsche Gesellschaft für Internationale Zusammenarbeit (GIZ GmbH); commissioned by the German Federal Ministry for Economic Development and Cooperation (BMZ); the Department of Sanitation, Water and Solid Waste for Development (Sandec) at the Swiss Federal Institute of Aquatic Science and Technology (Eawag); the water@leeds research group of the University of Leeds (UofL); the Water, Engineering and Development Centre (WEDC) of Loughborough University and the World Bank Water Global Practice

CC BY 2.0
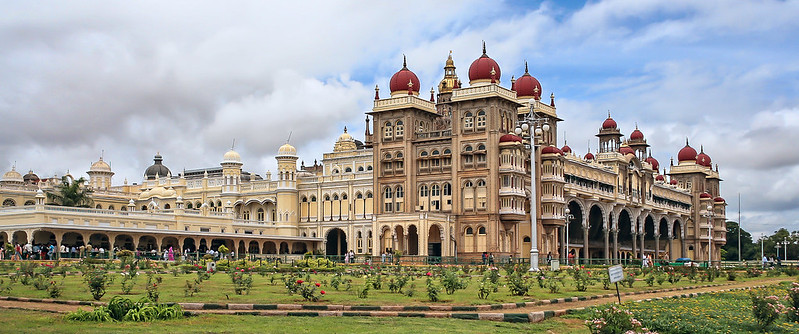
Mysuru City is situated in southern part of the state at 770 m above sea level. According to the census 2011, the population of Mysuru was 893,062 and number of households (HH) were 209,650. Overall, the SFD Graphic depicts that 72% of excreta is safely managed while 28% is discharged untreated to the environment. Wastewater through sewer systems is generated by 92% of the total population of the city. About 78% of this wastewater is reaching the treatment plants, resulting in 68% of treated wastewater. 21% of the wastewater is not delivered to treatment and close to 4% of the wastewater is delivered to treatment but not treated. Mysuru City is equipped with three STP based on aerated lagoon wastewater treatment system technology with treatment capacity of 187 MLD. As per field surveys and observations in Mysuru, 7% of the total population is dependent upon OSS out of which 1% of the total population of Mysuru has septic tanks in their respective households with outlet connected to open drain or storm sewer, 3% of the total population has lined pits with semi permeable walls and open bottom without any outlet or overflow and 3% has unlined pits with no outlet or overflow. Emptying frequency differs widely across the city, depending upon the type of OSS and the size of household. Faecal sludge is discharged by private emptiers into open drains or other water bodies, since no co-treatment is practised and there are no dedicated faecal sludge treatment plants. There is no treatment of the FS collected since it is discharged directly into the drains, reaching the environment, untreated.